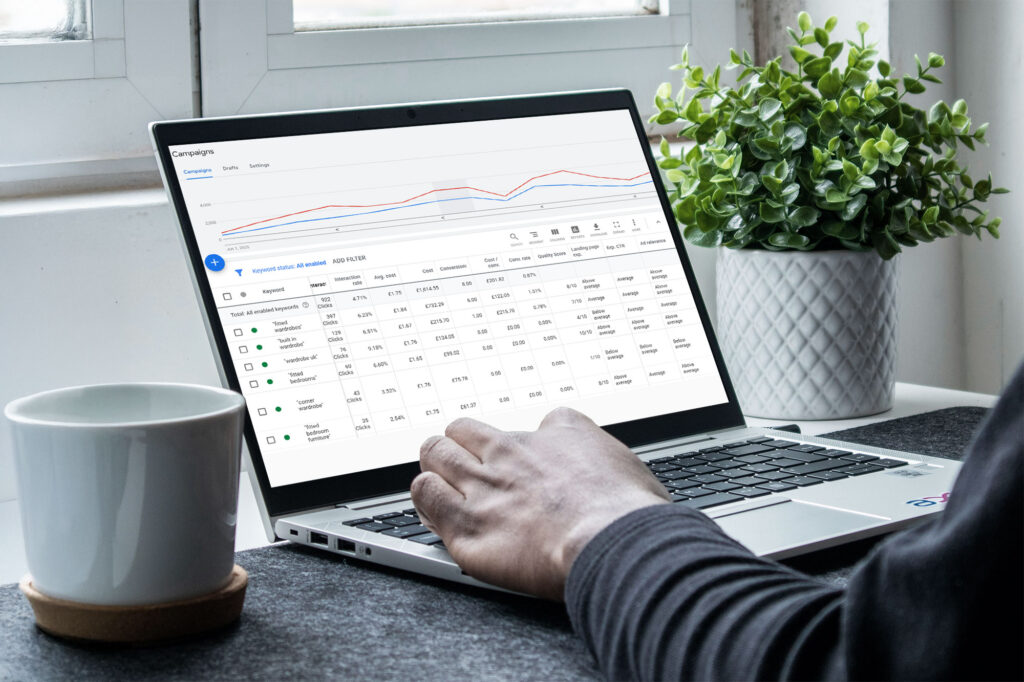
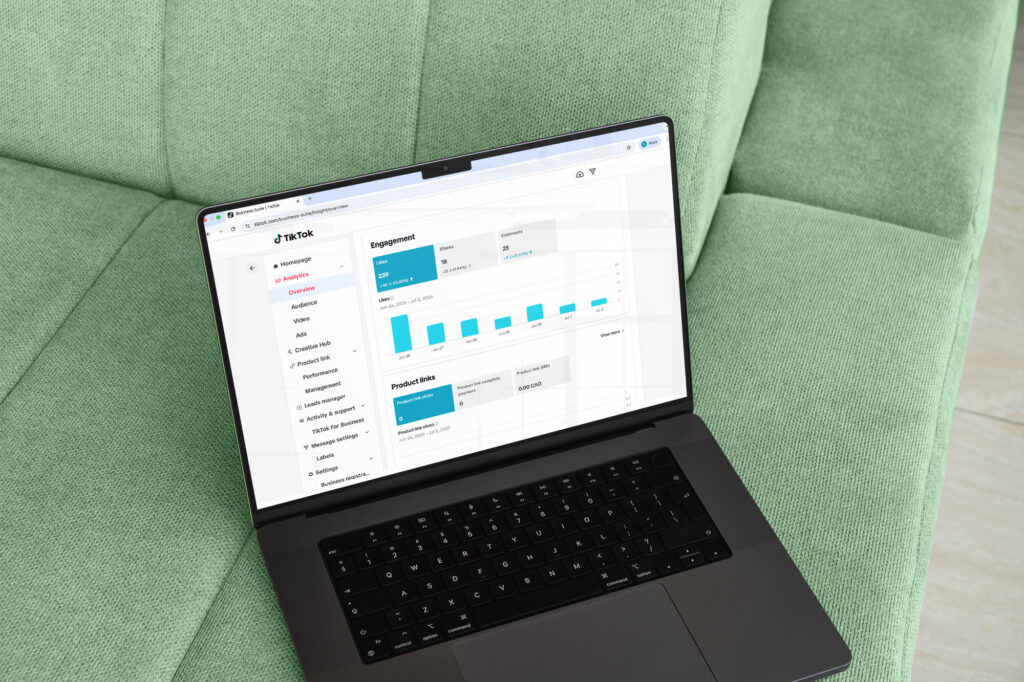
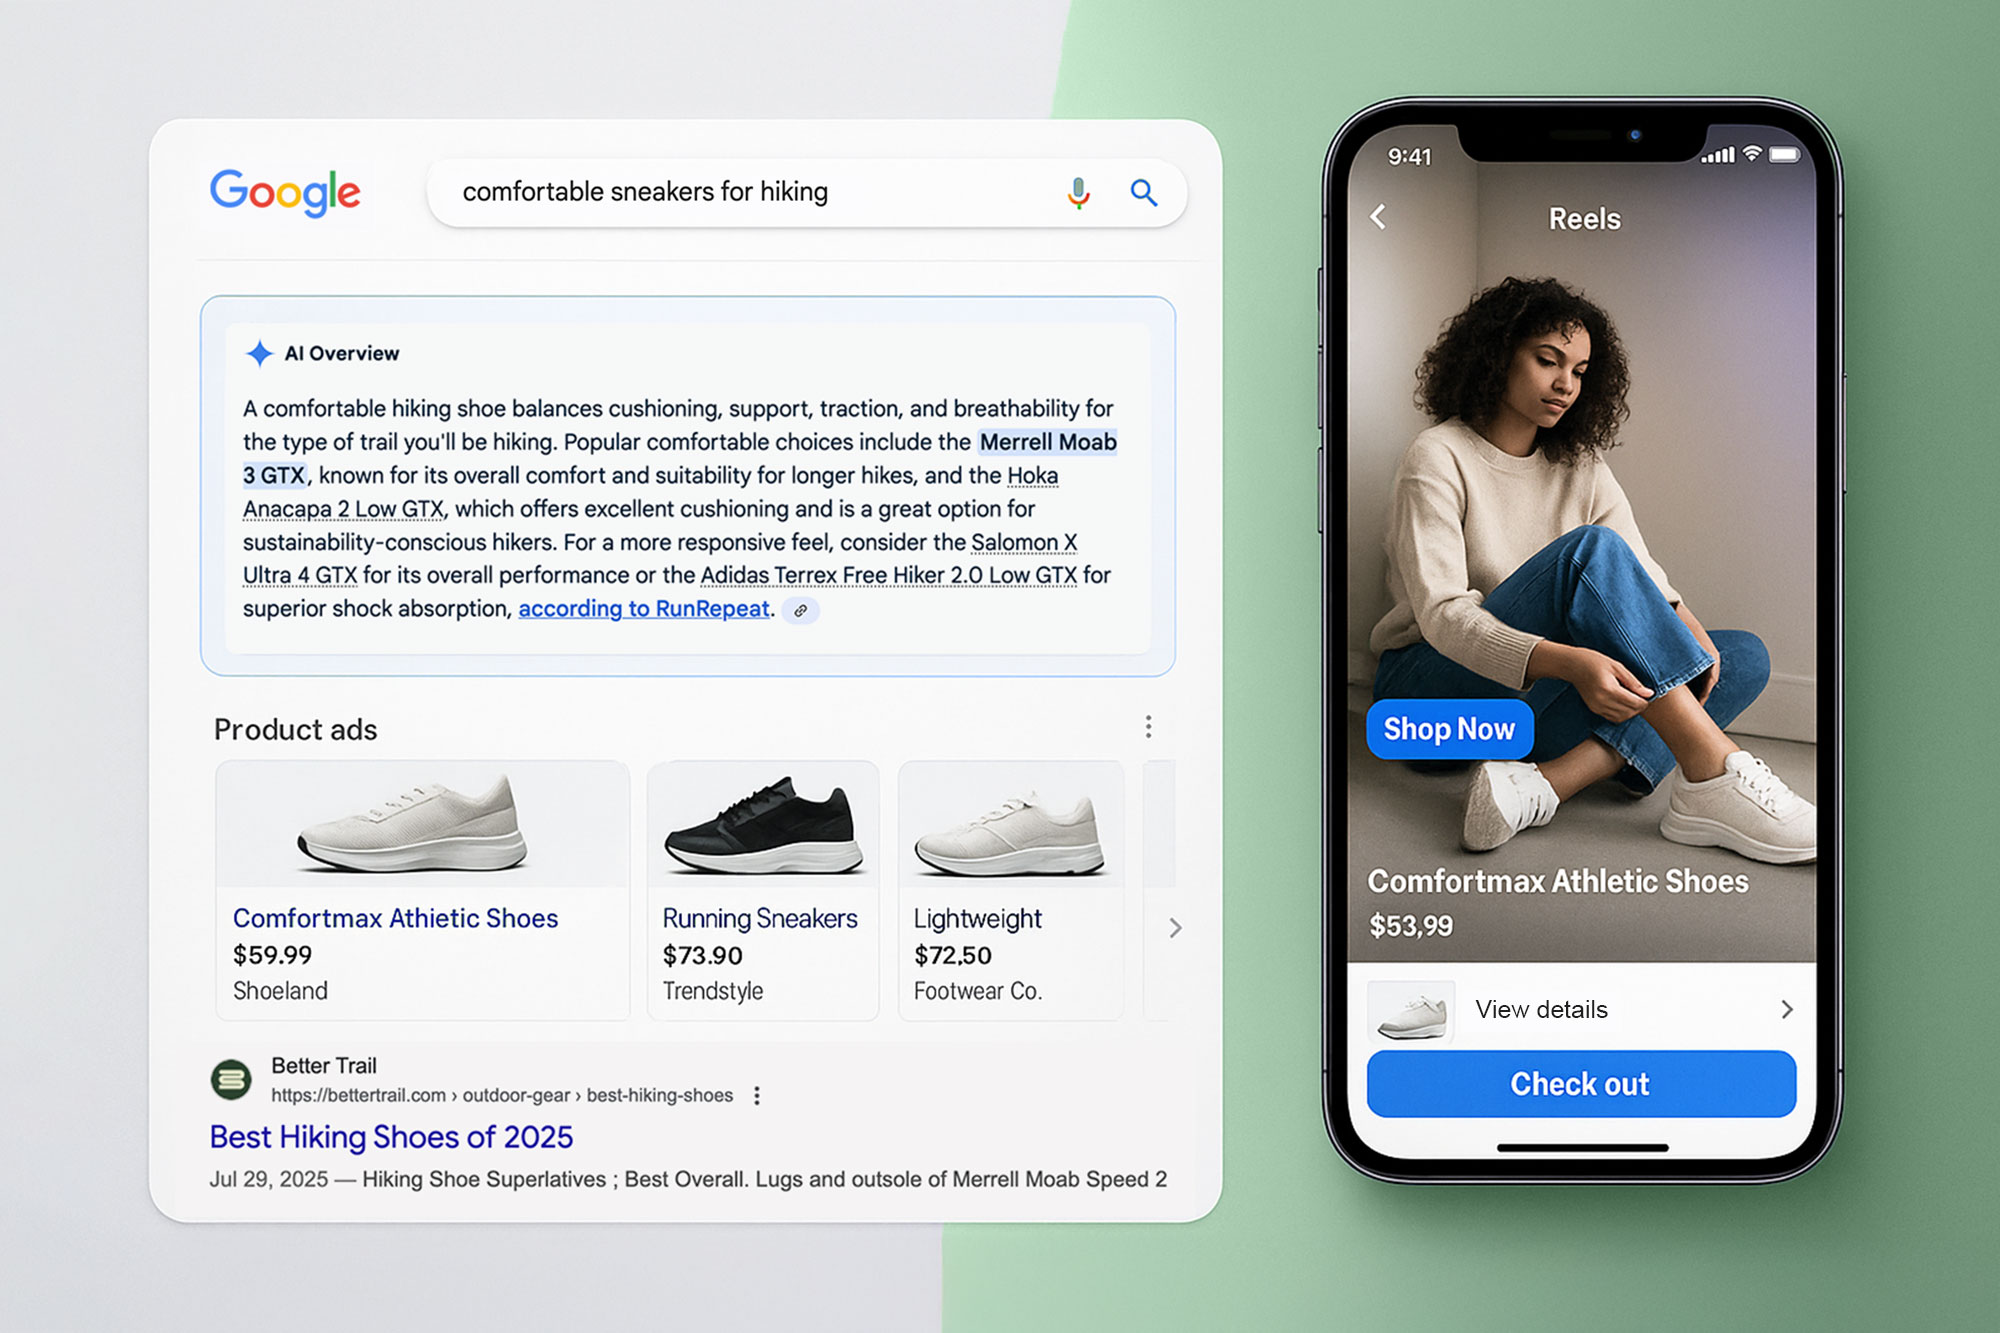
With endless data available, it’s easy to get distracted by vanity metrics. But without clearly defined KPIs (Key Performance Indicators), it’s hard to know what’s really working.
Choosing the right KPIs helps you focus on performance that actually drives results. These are the metrics that allow you to make smart decisions, optimize effectively, and ultimately get the most out of your ad budget—whether your goal is lead generation, sales, or brand growth. Here are 10 essential KPIs to track in your paid media campaigns—and why they matter.
1.Click-Through Rate (CTR)
Shows the percentage of people who clicked on your ad after seeing it. It’s a direct measure of how engaging and relevant your ad is to your audience.
Why it matters: A strong CTR can improve Quality Scores and lower your costs, while a low CTR signals that your creative or targeting might need work. A good benchmark to aim for is between 1.5% and 3% on Google Search, around 0.8% on Display ads, and approximately 1% on Meta platforms like Facebook and Instagram.

2. Cost Per Click (CPC)
Tells you how much you’re paying for each click on your ad. It’s influenced by factors like competition, targeting, and ad relevance.
Why it matters: A manageable CPC means you’re driving traffic efficiently—and makes room in your budget to scale results. In Canada, the average CPC typically ranges from $1.00 to $3.00 on Google Search, $0.30 to $1.00 on Display networks, and between $0.50 and $1.50 on Meta ads.
3. Conversion Rate (CVR)
This is the percentage of users who take a desired action (like filling out a form or making a purchase) after clicking your ad.
Why it matters: A high CVR shows that your landing page and offer are aligned with the intent of your visitors. A strong conversion rate generally falls between 2% and 5% for Google Search, 0.8% to 2% for Display, and 1.5% to 4% on Meta.

4. Cost Per Acquisition (CPA)
CPA tracks how much you’re paying to acquire a customer or lead. It’s one of the most important efficiency metrics.
Why it matters: Lower CPA = better return on investment. This KPI helps determine which campaigns are actually worth the spend. In Canada, a healthy CPA can range from $30 to $120 depending on your industry, with lead generation typically falling on the lower end and e-commerce or B2B on the higher end.
5. Return on Ad Spend (ROAS)
Measures how much revenue your campaign generates for every dollar spent. For example, a 4x ROAS means you’re earning $4 for every $1 invested.
Why it matters: It’s one of the clearest indicators of whether your paid media is driving business impact. A strong ROAS is usually between 3x and 5x, with e-commerce campaigns often targeting 4x or higher to remain sustainable.
6. Impressions & Reach
Impressions show how many times your ad is displayed, and reach indicates how many unique people saw it.
Why it matters: These metrics are useful for awareness campaigns and understanding how far your message is spreading. While these metrics don’t have fixed benchmarks, it’s important to monitor them for awareness campaigns and ensure your frequency stays below 3 to 5 to avoid ad fatigue.
7. Quality Score (Google Ads-specific)
Google assigns your ads a Quality Score based on relevance, landing page experience, and expected CTR.
Why it matters: A higher Quality Score can improve your ad placement and reduce CPC, making your budget go further. A strong Quality Score typically falls between 7 and 10, while scores under 5 indicate room for optimization.

8. Engagement Rate (Social Platforms)
This includes likes, comments, shares, and other interactions with your ad—especially relevant on platforms like Facebook, Instagram, and LinkedIn.
Why it matters: Engagement shows how well your message resonates with your audience and often correlates with stronger brand affinity. A solid engagement rate is usually between 1% and 3% on Meta, around 0.5% to 1% on LinkedIn, and can reach 2% to 5% for more dynamic formats like Instagram Reels or Stories.

9. Bounce Rate
Bounce rate tracks how many users land on your site and then leave without interacting.
Why it matters: A high bounce rate may indicate that your landing page isn’t aligned with user expectations—or that your site experience needs improvement. A bounce rate between 40% and 60% is considered normal, with anything below 40% indicating very strong performance.
10. Average Session Duration & Pages per Session
These metrics show how long users stay on your site and how much they explore after clicking through.
Why it matters: Higher engagement usually means users are finding value, which often leads to better conversion potential. A typical Average session duration is between 1 minute 30 seconds and 2 minutes 30 seconds. While a healthy benchmark to aim for pages per session is between 2 and 4 pages, showing that users are exploring your content and navigating through your site effectively.
Tracking the right KPIs isn’t just good practice—it’s the foundation of any successful paid media strategy. These metrics help you move past surface-level stats and uncover what’s actually driving performance. Whether you’re running search, social, or display campaigns, focusing on these KPIs will help you maximize impact and continuously improve.
If you’re ready to stop guessing and start optimizing, we’re here to help. Our team focuses on meaningful metrics and smart strategy—so your paid media budget drives real, measurable results.


